Global models for the maritime industry
Worldwide picture of shipping
“More than 2.5 gigabytes of new data are added to our database every hour. With these data, we focus on processing and analysing information services for the maritime industry. Deltares plays an important role in improving our understanding of tides and ocean currents,” says the director of the Made Smart Group, Luuth van der Scheer.
MSG Tracker is a real-time application for collecting and analysing shipping information. MSG Navigator is a passage or route planning tool that uses the latest sea charts in combination with millions of routes to plan the shortest and safest routes between ports. They are products offered by the Made Smart Group, which now ‘observes’ more than 200,000 ships around the world. “We are a data science company that collects information and transforms it into analyses that can be used by the shipping industry,” summarises Luuth van der Scheer.

“To make our analyses, we look not only at ship movements but also at the wind, tides and currents.”
Luuth Scheer - Director of the Made Smart Group
Improved insights
The Made Smart Group got in touch with Deltares in 2017. The company was looking for a better picture of ocean tides and currents. “We read an article by Deltares about GLOSSIS, the global model for predicting high water levels worldwide,” recalls Van der Scheer. “Before then, we usually processed local monitoring data. That involves installing buoys in the water at a specific location to take measurements, and using the results to make forecasts. We needed a planetary perspective, and the global models helped us to improve our products for our clients.”
Wind, tides and currents
Those clients include the P&I Clubs, a collective of shipowners who work together to develop and manage insurance cover for their vessels. Van der Scheer: “When there is an incident or collision, the question is how the accident has happened. Is it a piloting error? Who is responsible? To analyse that, we look not only at ship movements but also at the wind, tides and currents. In that way, we can advise our clients even better on the basis of the data.”
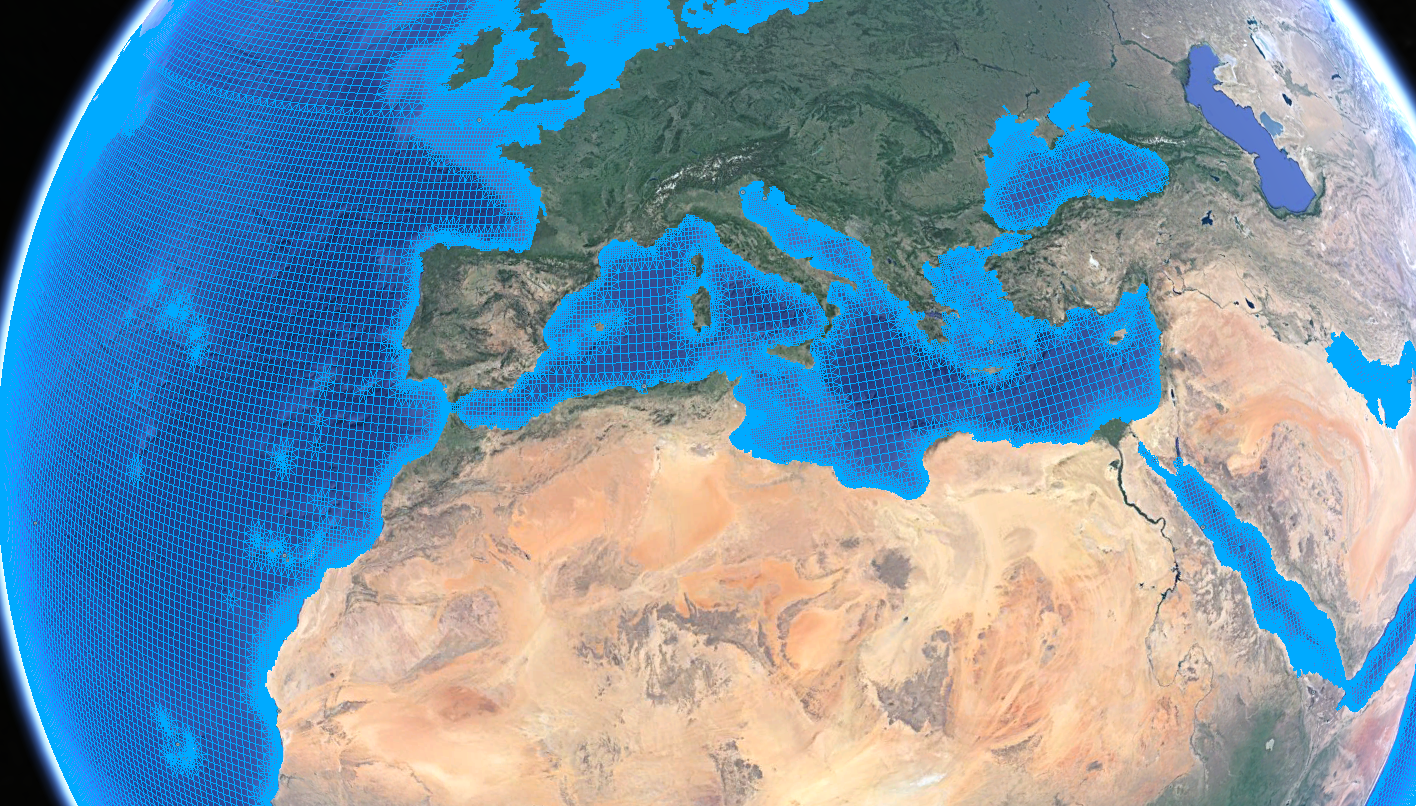
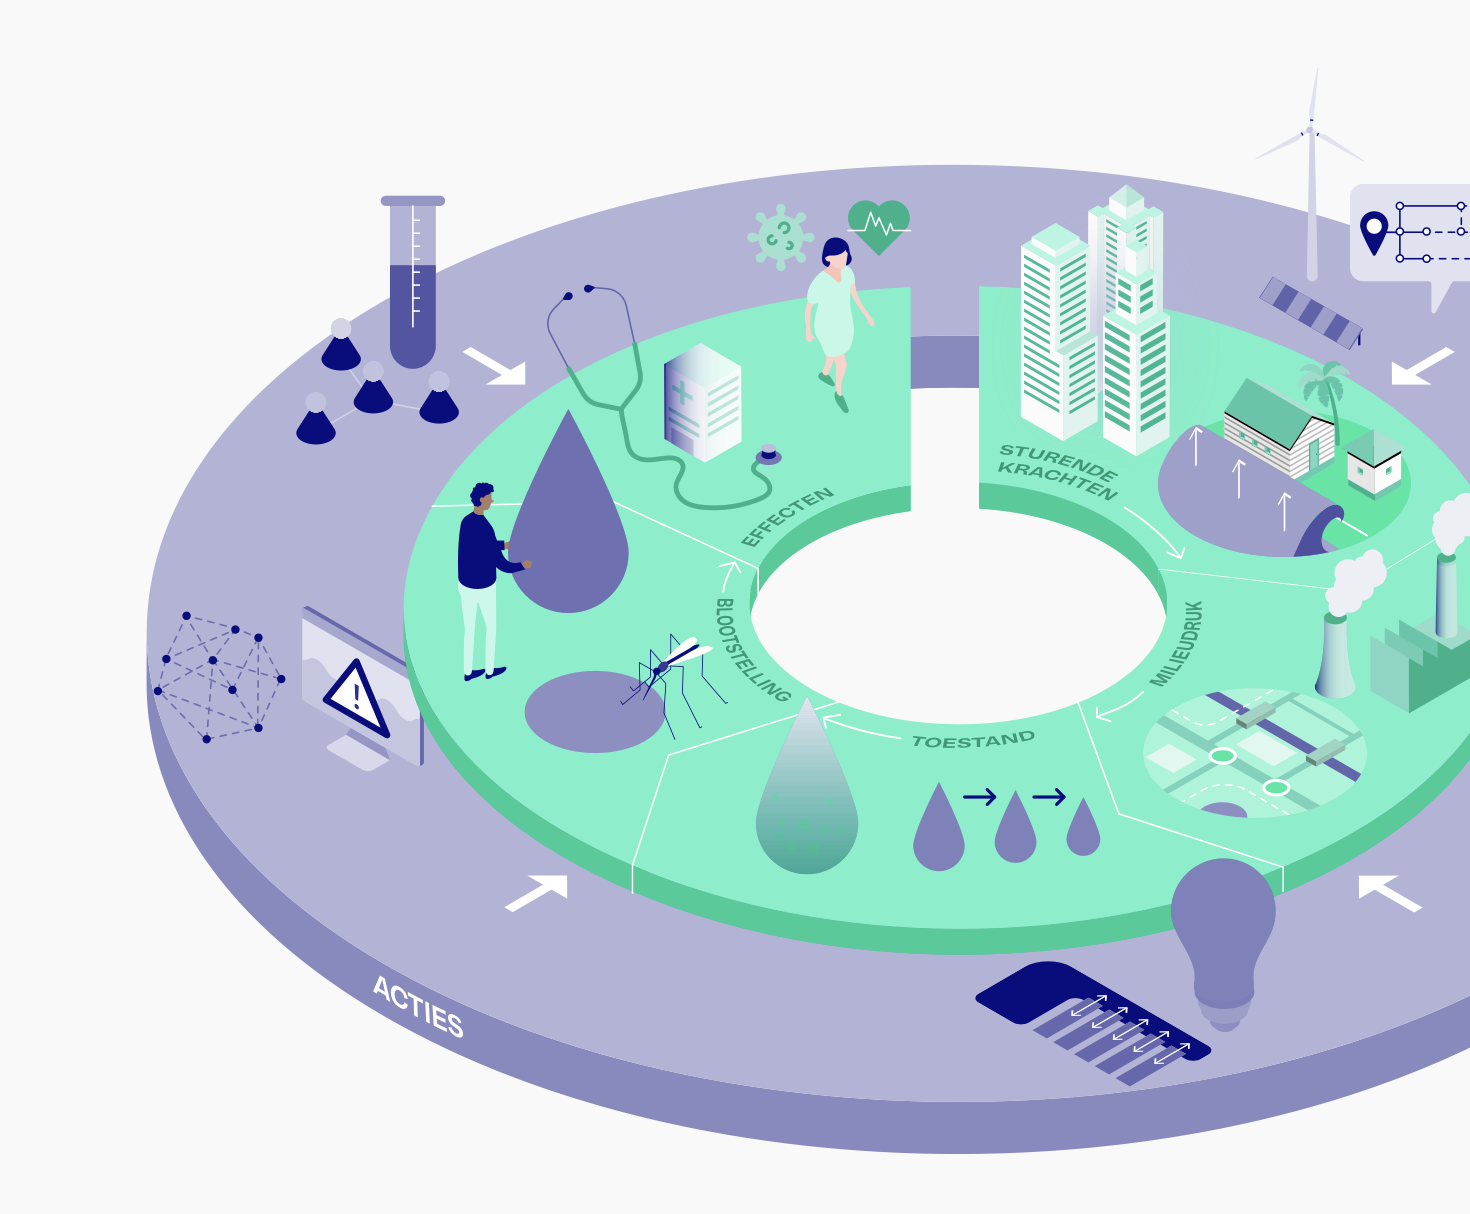
GLOSSIS model
Salvage operations are another example, when a ship runs aground and needs to be refloated. But when do you deploy your salvage equipment at high tide? “You can work out when high tide will be but strong winds can push up the level of the water so that it is higher than expected. The models help us here and the great thing is that they are global because salvage operations take place throughout the world.”
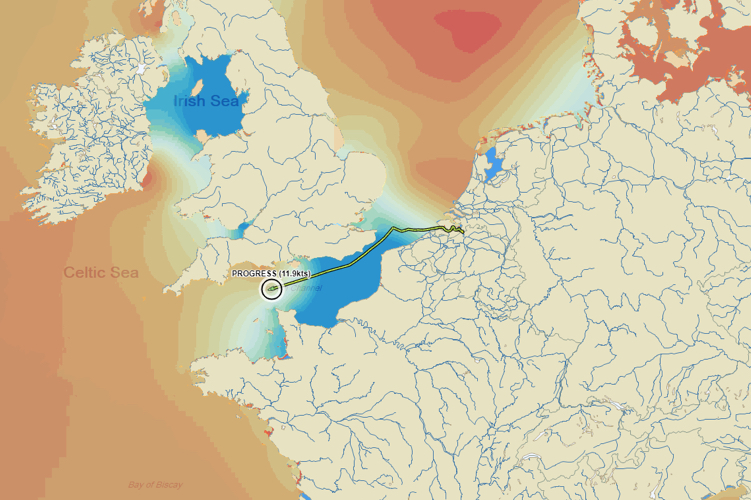
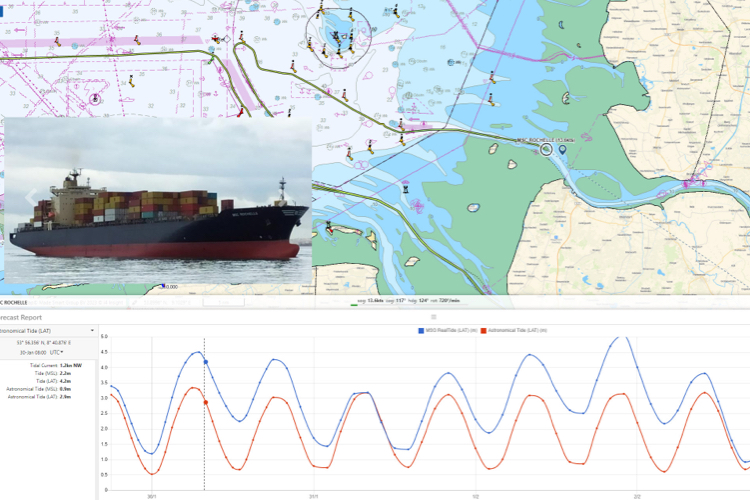
MSG Tracker
The MSG Tracker can be used to plot a ship’s course and determine whether the water will be deep enough during the voyage. Water depths actually change constantly. You can also analyse after the event why a ship has run aground.
i Position
Position of the ship at this moment.
i Shipping route
This ship has the port of Antwerp as its destination.
i Water depth
The colours indicate water depths. Red is high tide and blue is low tide.
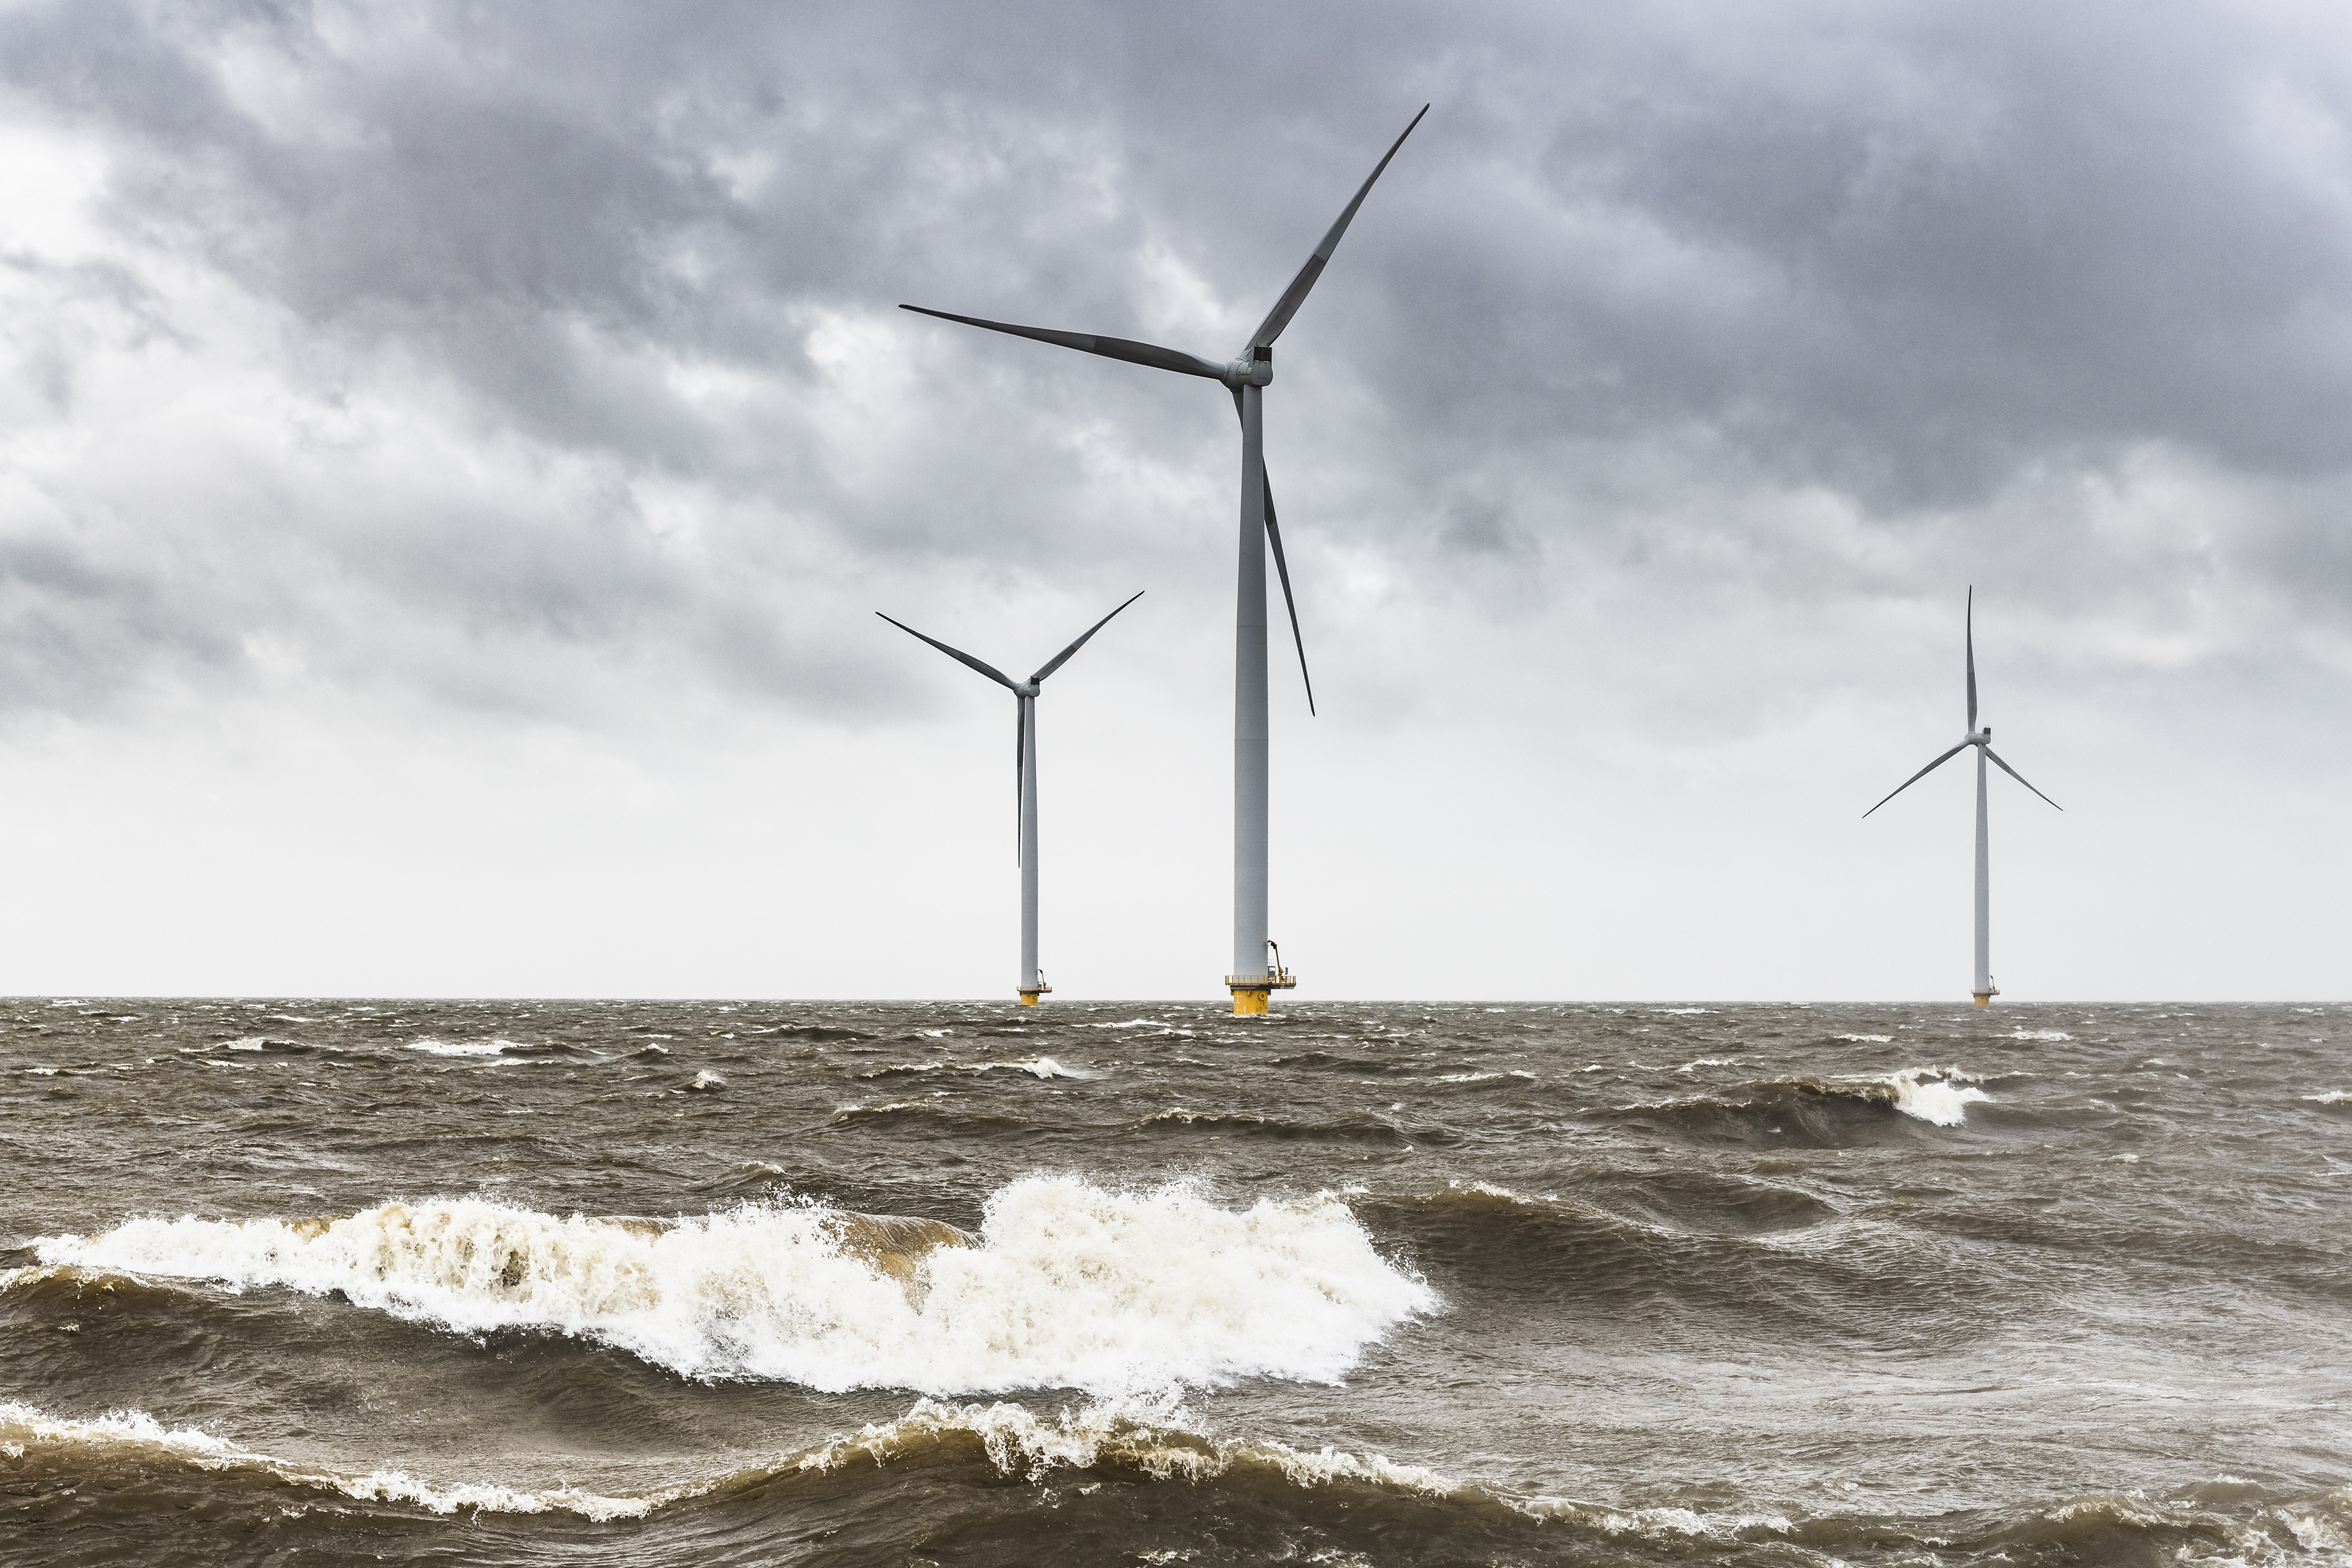
Wind-assisted sailing
The Deltares models make shipping safer, but Van der Scheer says there’s more. “The models also can also result in sustainable solutions. Bert Jeeninga, our innovation director, is leading a research project in which we are investigating wind-assisted sailing for ships with sails. But how can you harness that wind energy? You can watch the wind but you also have to take currents and waves into account. We look at these factors and develop passage schedules and route optimisation taking into account the energy burden on the vessels. With all the data available, AI is now coming into the picture.”
“The alliance with Deltares is a great example of how knowledge institutes can also support private initiatives.”
Bert Jeeninga - Innovation director of the Made Smart Group
Van der Scheer believes that the alliance with Deltares is a great example of how knowledge institutes can also support private initiatives. “Deltares is known for its Research & Development: they can really help us,” he says. “We still have some work to do to make the data suitable for our operational applications but we are working on that in close cooperation and they incorporate our feedback into subsequent versions of the models. This knowledge can lead to new and derivative products, which is why the support from Deltares is so valuable for us.”
Changes in the water level
This figure shows the changes in the water level over time. The periodical tidal patterns are clear to see. A graph of this kind can be used to estimate, for example, when it is best to pull free a grounded vessel.
More information
Martin Verlaan
Data expert